Feature
Know it before the client does.
Heatmaps show when your team works. Leaderboards show who's productive. Compliance dashboards show SLA performance. It's all in one place.
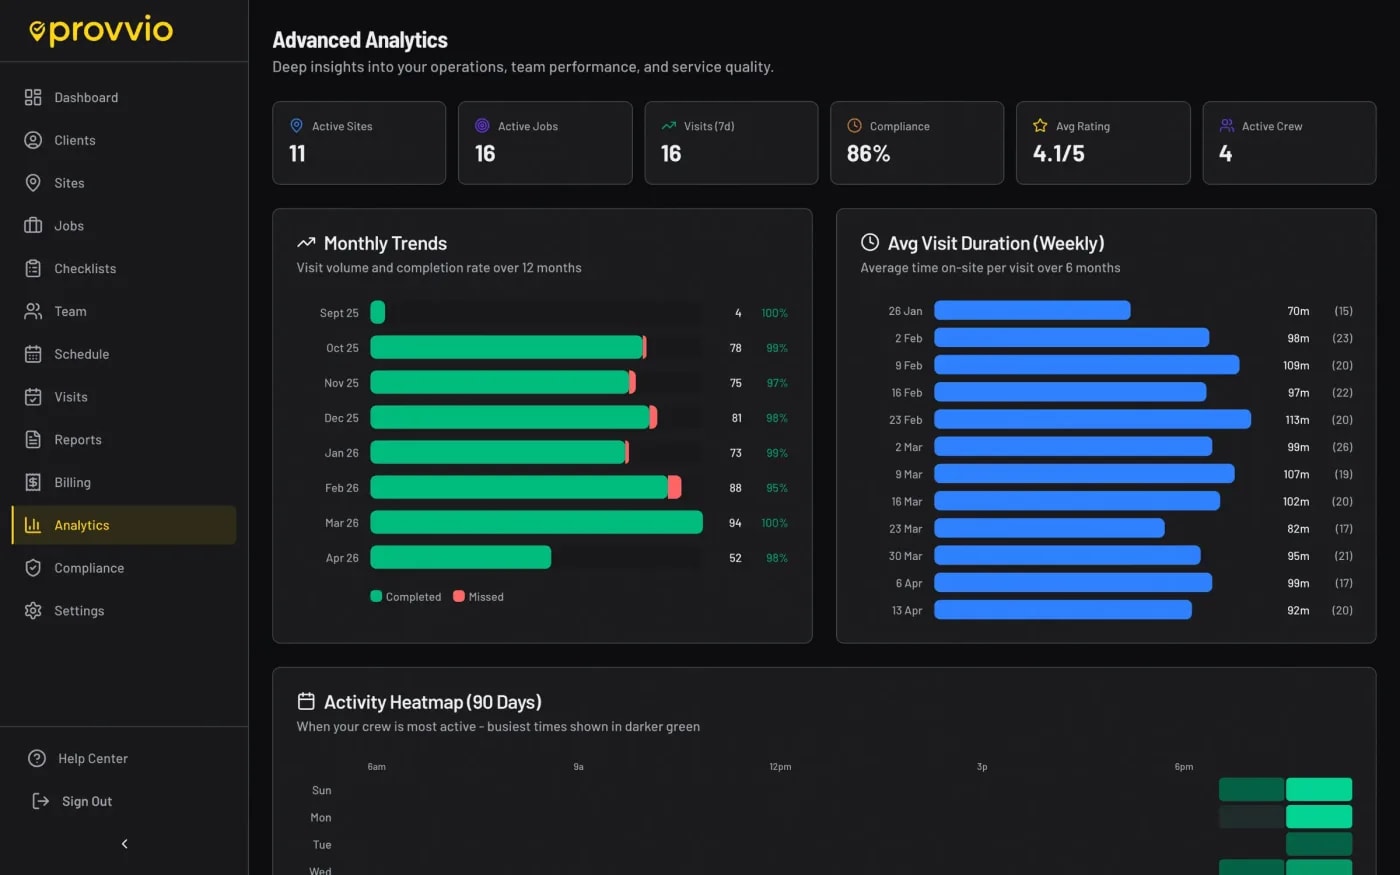
Activity heatmap
90-day view of when your team actually works. Spot patterns, empty days, overloaded evenings.
Team leaderboard
Who's completing visits, on time, with full checklists. Sort by completed, missed, photos, or duration.
Monthly trends
12 months of visit counts, completion rates, missed visits. The trend line tells the story.
Per-client compliance
Compliance percentage per client, auto-calculated. Spot the client you're slipping on before they do.
Average visit duration
Weekly duration trends per team, per site, per service type. Catch visits that are shrinking.
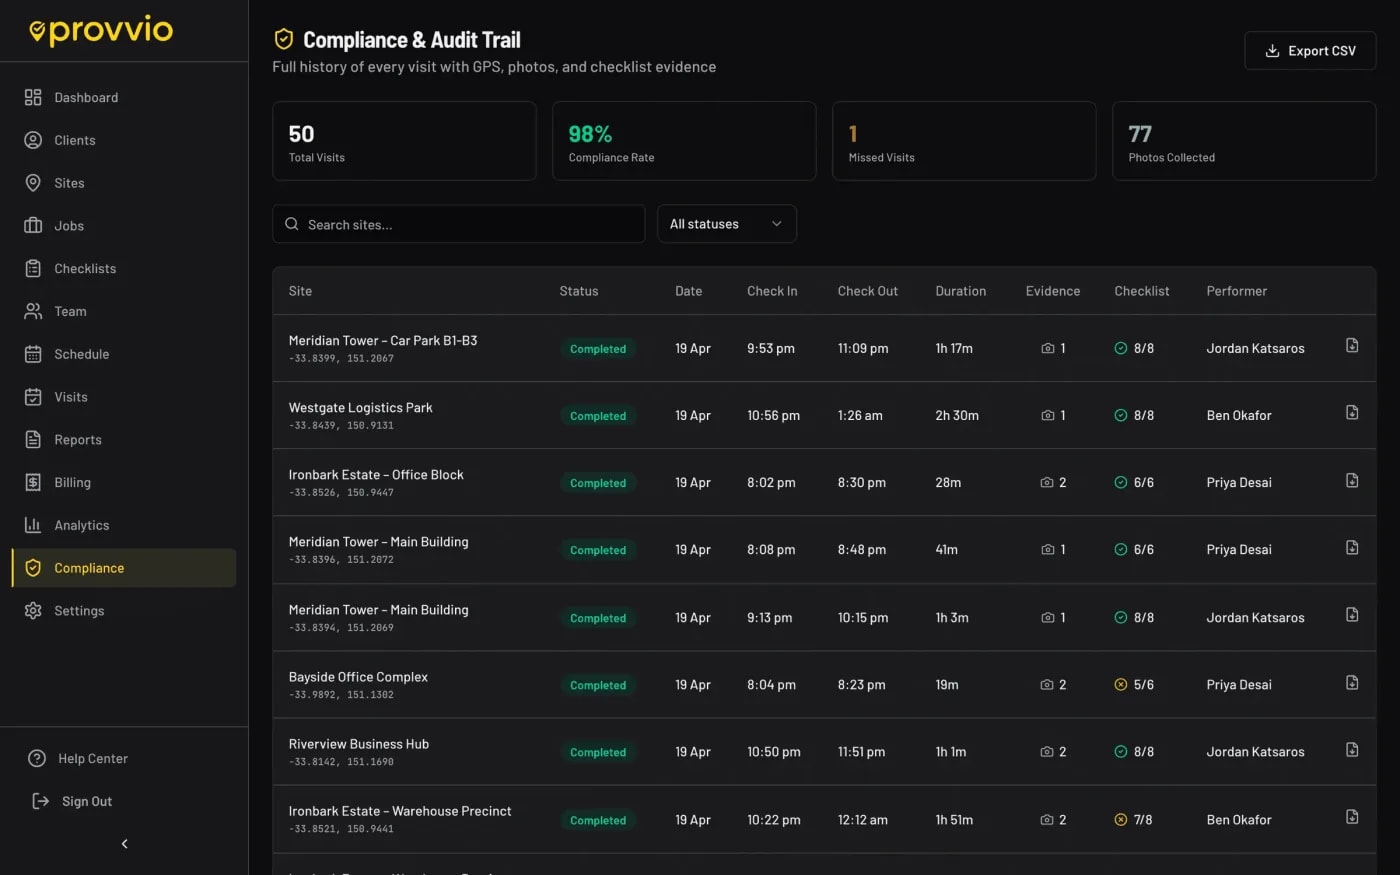
Missed visit alerts
Every missed visit is logged with reason and owner. No more 'it just didn't happen'.
You've always known something was off. Now you can prove it.
Most business owners feel when things are slipping. A client is getting short visits. A crew member is doing more photos but less work. A site keeps racking up missed visits on Wednesdays.
Analytics turns that gut feel into numbers. You stop guessing. You stop arguing. You just show the chart and have the conversation.
Frequently asked
How far back does the data go?+
Can I export analytics to Excel or CSV?+
Are alerts customisable?+
Is analytics available on all plans?+
Related features
Ready to prove the work happened?
Free 14-day trial. No credit card. See your first proof pack in under 10 minutes.